
“Your best customers are your existing customers. Retain them and you’ll be rewarded with their loyalty, advocacy, and ongoing business. Acquiring new customers is important, but retaining existing ones is paramount.” – Shep Hyken
Customer retention refers to the ability of a company to retain its customers over a given period. It may seem blindingly obvious, but many organizations don’t prioritize retention. The focus is always on acquiring more new customers. But, studies show that increasing customer retention rates by just 5% can increase profits by 25% to 95%. In essence, a higher customer retention rate equals increased revenue without actually bringing in new customers.
It is crucial to prioritize customer retention as much, if not more, than acquiring new customers. For this reason, tracking and enhancing customer retention metrics is a crucial responsibility for business leaders as it can greatly impact the company’s financial performance and growth over time.
Let’s get into everything that you need to know.
Using Data and Setting Goals
Successful customer retention starts with understanding what success looks like for your organization. Once you’ve defined success, gather the data you need to measure it. This could be historical sales data, customer service interactions, or even social media feedback.
Next, establish benchmarks using this data. These are your starting points for improvement. From there, set SMART (Specific, Measurable, Achievable, Relevant, Time-bound) goals that align with your overall business objectives.
Monitoring progress is crucial in achieving these goals. Use dashboards or automated reports to keep track of your metrics regularly. Lastly, don’t forget to refine and continually improve your strategies based on the insights gained from these metrics.
Let’s dive deeper into the specifics.
Key Metrics for Tracking Customer Retention
There are several key metrics that provide insight into how well your business is retaining customers:
Customer Retention Rate:
This basic, but crucial metric provides valuable insights into the effectiveness of your customer retention efforts.
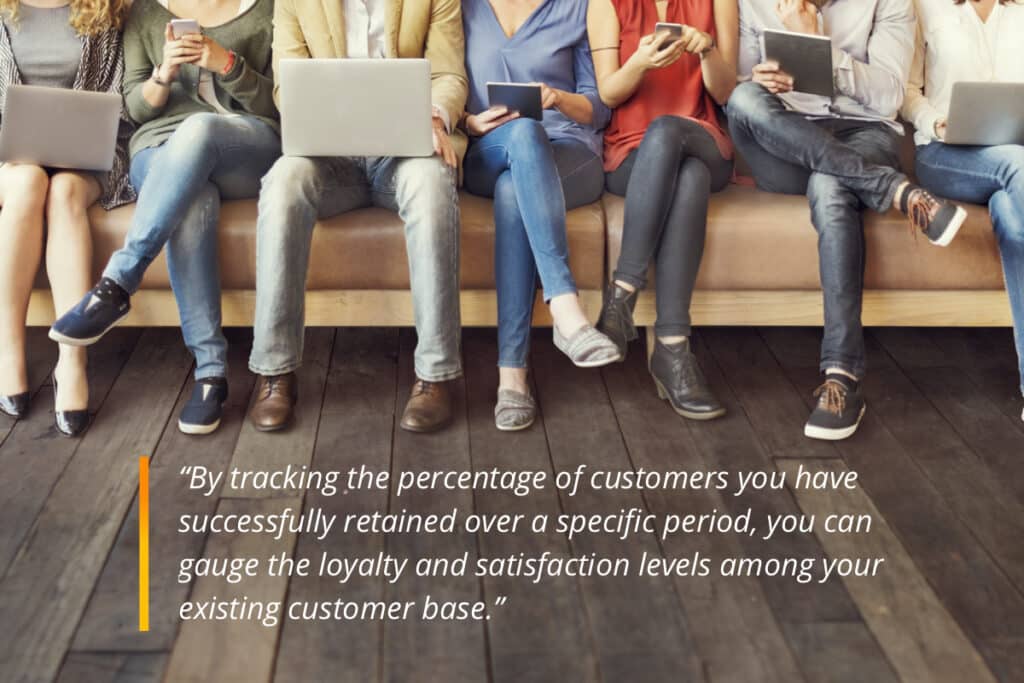
By tracking the percentage of customers you have successfully retained over a specific period, you can gauge the loyalty and satisfaction levels among your existing customer base.
Measuring customer retention rates allows your organization to assess its broad strategies and initiatives aimed at retaining customers — starting with providing high-quality products and services. It also reveals how successful you are in building strong relationships with your customers and fostering long-term loyalty.
By analyzing trends and patterns within the data, you can determine which factors contribute to higher or lower rates of customer retention. For instance, a high retention rate will likely indicate that customers find value in your products or services. On the other hand, a low retention rate could signify issues such as poor product quality, inadequate support services, or subpar overall experiences that prompt customers to abandon your brand.
Customer Churn
Also known as customer attrition or customer defection, this metric measures the percentage of customers who have chosen to terminate their relationship within a specific timeframe.
This is an essential indicator to closely monitor and analyze in order to evaluate the effectiveness of your retention strategies.
Customer churn rate is typically calculated by dividing the number of customers lost during a certain period by the total number of customers at the beginning of that period.
By leveraging advanced analytics tools and segmentation techniques, marketers can further analyze different segments’ susceptibility to churn. This deeper level of analysis helps identify key patterns and characteristics associated with higher attrition rates among specific groups of customers. Armed with this knowledge, targeted interventions tailored towards those at risk can be devised more effectively.
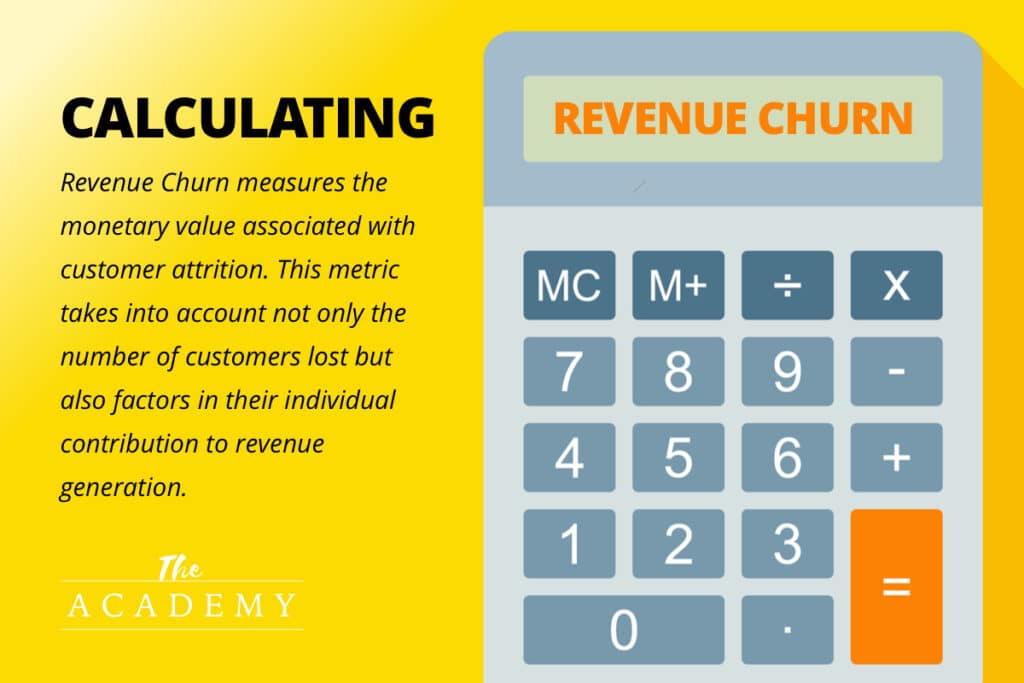
Revenue Churn
This is a crucial metric that provides valuable insights into the financial impact of customer churn.
This is another metric that quantifies the amount of revenue lost as a result of customers discontinuing their relationship with a company. By tracking Revenue Churn, organizations can continue to assess the effectiveness of their strategies in retaining customers and identify areas for improvement.
Revenue Churn measures the monetary value associated with customer attrition. This metric takes into account not only the number of customers lost but also factors in their individual contribution to revenue generation.
Understanding Revenue Churn allows marketing managers to evaluate both short-term fluctuations and long-term trends in customer retention. By monitoring this metric over time, they can observe patterns and determine if there are certain periods or events that lead to higher churn rates and subsequent revenue decline.
Existing Customer Growth Rate:
This metric measures the rate at which revenue is growing from your existing customer base.
A higher growth rate signifies that customers are not only staying loyal to the brand but also increasing their spending over time. On the other hand, a stagnant or declining growth rate may indicate issues with customer retention strategies or dissatisfaction among existing clients.
To calculate the existing customer growth rate, you need to compare the revenue generated by existing customers within a specific period (such as monthly or annually). By comparing these figures against previous periods or industry benchmarks, managers can assess whether they are effectively nurturing and cultivating long-term relationships with their customer base.
Understanding the existing customer growth rate allows your organization to evaluate different initiatives aimed at driving additional sales from current clientele. For instance, if there is a notable increase in this metric after launching a new loyalty program or personalized upselling campaigns targeting specific segments of their client base, it indicates that these efforts have been effective in fostering stronger relationships and encouraging more purchases.
Product Return Rate
This measures the percentage of products returned by customers, providing valuable insights into customer satisfaction and overall product quality.
A high return rate could indicate potential issues with your product, such as defects or poor performance, which may lead to customer dissatisfaction and ultimately impact customer retention. By tracking this metric, you can identify areas for improvement in product design, manufacturing processes, or even customer service interactions that may be contributing to a higher return rate.
Additionally, analyzing trends in the product return rate over time can help businesses assess the effectiveness of any implemented changes or improvements made to address previous issues. Ultimately, monitoring and addressing the product return rate is essential for enabling customer retention and ensuring long-term business success.
Net Promoter Score (NPS)
The Net Promoter Score (NPS) is a customer loyalty metric that quantifies the willingness of customers to recommend a company’s products or services to others on a scale from -100 to 100.
As organizations strive to optimize their strategies, clearly understanding the level of satisfaction among customers becomes crucial in order to enhance overall product quality and ensure long-term relationships, repeat purchases, and advocacy.
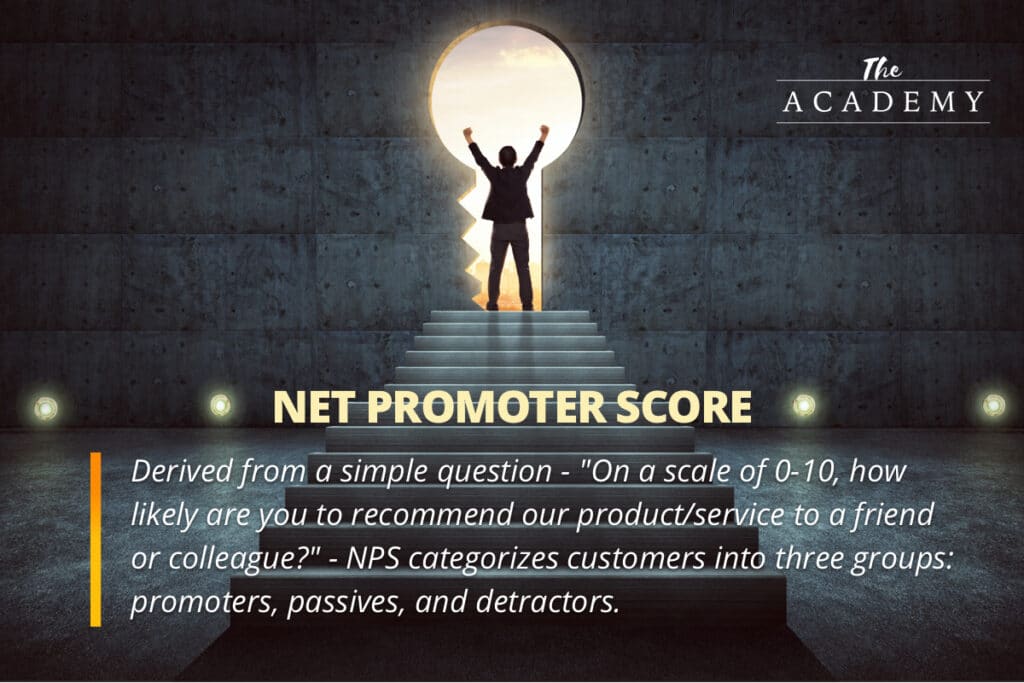
Derived from a simple question – “On a scale of 0-10, how likely are you to recommend our product/service to a friend or colleague?” – NPS categorizes customers into three groups: promoters, passives, and detractors. Promoters are extremely satisfied customers who actively endorse the brand and generate positive word-of-mouth referrals. Passives fall in the middle range, expressing neither strong enthusiasm nor clear dissatisfaction with the product or service. Detractors, on the other hand, indicate significant dissatisfaction and may even discourage others from trying out the offering.
By calculating the percentage of respondents falling into each category and subtracting the percentage of detractors from that of promoters, companies can obtain their Net Promoter Score ranging between -100 to +100. This score acts as an essential benchmark for evaluating customer loyalty levels while also highlighting areas requiring improvement within products or services.
Tracking NPS over time also allows organizations to identify trends in customer sentiment toward their offerings. A consistently high NPS indicates strong customer satisfaction levels which often translate into increased repurchase rates and brand advocacy. Conversely, a declining NPS signals potential issues impacting customer experience that obviously need direct and immediate attention.
Customer Lifetime Value (CLV)
This crucial metric serves as a powerful tool for organizations to predict the net profit that can be attributed to the entire relationship with a customer.
By analyzing and calculating customer lifetime value, businesses gain valuable insights into their customers’ long-term value and potential profitability.
Understanding CLV enables organizations to make informed decisions about resource allocation, budget planning, and overall business strategy. By quantifying the projected revenue from a customer over their lifetime, this metric allows companies to prioritize their efforts toward retaining high-value customers who have the potential for repeat purchases and long-lasting loyalty.
CLV helps in assessing customer satisfaction levels by indicating how much value customers derive from products or services offered. A higher CLV indicates strong customer satisfaction as it implies that they are more likely to continue purchasing from the brand in the future.
Tracking changes in CLV over time can shed light on shifts in customer behavior patterns or market dynamics. For instance, if there is a decline in average CLV across a specific segment of customers or during certain periods, it may signify issues with product quality or declining customer satisfaction levels. This insight prompts marketing managers to investigate further and take corrective actions such as improving product features or enhancing customer support processes.
By taking into account various factors including acquisition costs, retention rates, average purchase values, and churn rates when calculating CLV accurately; marketing managers can better comprehend which strategies yield maximum returns on investment. With this knowledge at hand, they can optimize their marketing campaigns to focus on the most profitable customer segments.
Using Metrics to Improve Customer Retention
Analyzing and improving the tracked metrics is a crucial step toward enhancing customer retention. Here are just a few final thoughts.
Customer Feedback Surveys
Take, for example, the Net Promoter Score (NPS) – if it appears to be low, implementing a customer feedback survey with a tool like Hubspot or Google Forms can provide valuable insights into understanding what factors contribute to dissatisfaction among customers. By identifying these pain points, companies can then address them directly and work towards resolving any issues that may be hindering customer satisfaction.
Amazon Case Study
Numerous companies have already demonstrated their ability to improve customer retention metrics effectively. One standout example is Amazon, which has utilized personalized recommendations as a powerful tool for boosting repeat purchases. Through sophisticated algorithms and data analysis techniques, Amazon tailors product suggestions based on individual preferences and past buying behavior. This level of personalization enhances the overall shopping experience for customers while also increasing the likelihood of continued engagement with the brand.
Zappos Case Study
Another company that excels in maintaining high levels of customer retention is Zappos. What sets them apart is their unwavering commitment to exceptional customer service. Zappos goes above and beyond in ensuring every interaction with their customers exceeds expectations – from providing 24/7 support to offering hassle-free returns or exchanges. Such dedication fosters trust and loyalty among customers, leading to impressive rates of repeat business.
By emulating these success stories and adopting strategies tailored to each company’s unique circumstances, marketing managers can make significant strides in improving their own customer retention metrics. The key lies not only in tracking these metrics but also in leveraging them as tools for continuous improvement across various aspects of a company’s marketing operations.
The time is now to start and then continually improve
Tracking customer retention metrics is vital to any business’s success. As a business owner or marketing manager, you have the power to significantly impact these metrics through data-driven decision-making and strategic digital marketing planning. So start applying these metrics in your strategies today, and you’ll soon see improvements in customer loyalty, satisfaction, and most importantly, increased revenue for your business.
As we move forward, one thing is clear: customer retention strategies will continue to evolve. But by staying on top of key metrics and continually refining your strategies based on data, you’ll be well-equipped to navigate this ever-changing landscape.

Related Articles:

Panel Recap: How to Optimize Your LinkedIn Presence
I recently had the opportunity to speak on a panel hosted by the Canton Chamber of Commerce, where we dove into one of today’s most…

3 Powerful Benefits of Local Business Partnerships
Most businesses naturally focus their time and resources on proven sales and marketing tactics to bring in new customers—think networking, sales calls, ads, social media,…

Are You Ready to Partner with a Digital Marketing Agency?
Establishing a robust online presence is crucial for your business’ success. Digital marketing offers endless opportunities to reach new customers, enhance brand awareness, and drive…


Most Popular Articles

Seeing Favicons in Your Google Search Results? Here’s Why…
Have you noticed anything different in your Google Search results lately? Google added tiny favicon icons to its organic search results in January. It was…

Business Growth and Digital Marketing News & Tips 11-17-24
Are you encouraging and rewarding innovation? Lee Cockerell is the former Executive Vice President of Operations at Walt Disney World. A lover of traditional red…

Business Growth and Digital Marketing News & Tips 11-27-24
A culture of gratitude "Feeling gratitude and not expressing it is like wrapping a present and not giving it." – William Arthur Ward Beyond being…